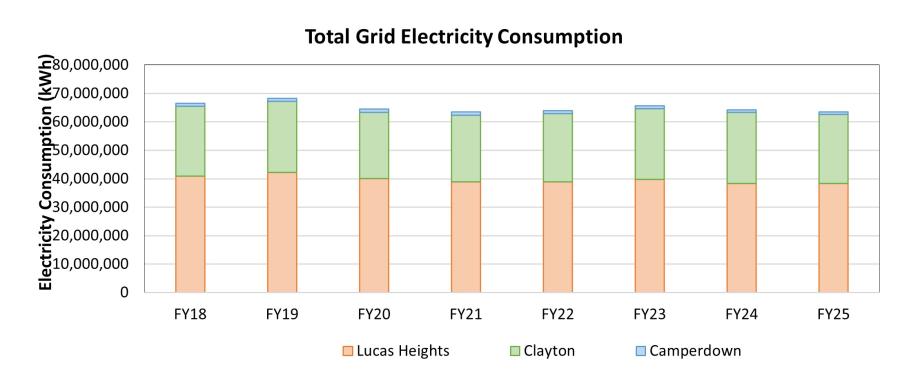

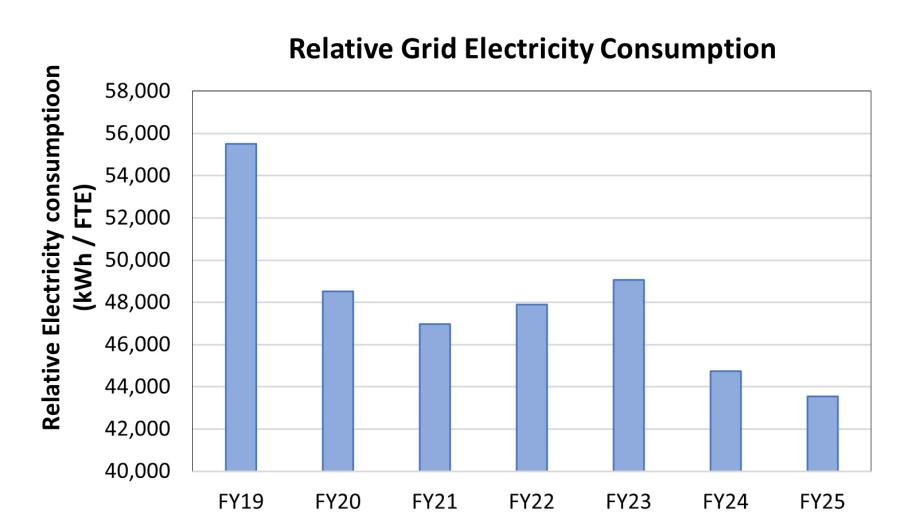
Electricity Consumption
The continued decrease in electricity consumption is primarily due to OPAL reactor long shutdown, which extended through to September 2024. During this time, electricity consumption from the OPAL facility was 50-60% lower than when the reactor is at full power.
ANSTO currently has about 1.6 megawatt (MW) of installed renewable energy sources. In January 2024, ANSTO commissioned a new 1.5 MW solar array at its Clayton facility. This array has the potential to produce about 1,800 megawatt-hours of electricity annually.
The new solar array produced 1,822 MW of electricity in FY25. This production is fully utilised by synchrotron activities, which require significant amounts of electricity to control the electron beams.
All new buildings are required to have roof-top solar installed. ANSTO continues to assess the viability of retrofitting roof-top solar across existing buildings at the Lucas Heights campus.
ANSTO continues to install new infrastructure and replace legacy energy inefficient systems which will improve energy utilisation and reduce overall electricity consumption from the grid.
Resource usage table (FY2024 vs FY2025)
| Resource Usage | Units | FY2024 | FY2025 | Change on previous year (%) |
|---|---|---|---|---|
| Electricity | GWh | 64.2 | 63.5 | -1.1 |
| GWh/ FTE | 0.045 | 0.044 | -2.2 | |
| Installed renewable energy sources | kW | 1766 | 1766 | 0.0 |
| Natural gas consumption (Clayton and Camperdown only) | GJ | 11,876 | 12,350 | 4.0 |
| GJ/FTE | 75.7 | 71.5 | -5.5 | |
| Passenger vehicle use - petrol and diesel | L/100km | 7.38 | 6.93 | -6.1 |
| L/FTE | 9.3 | 7.1 | -23.7 |
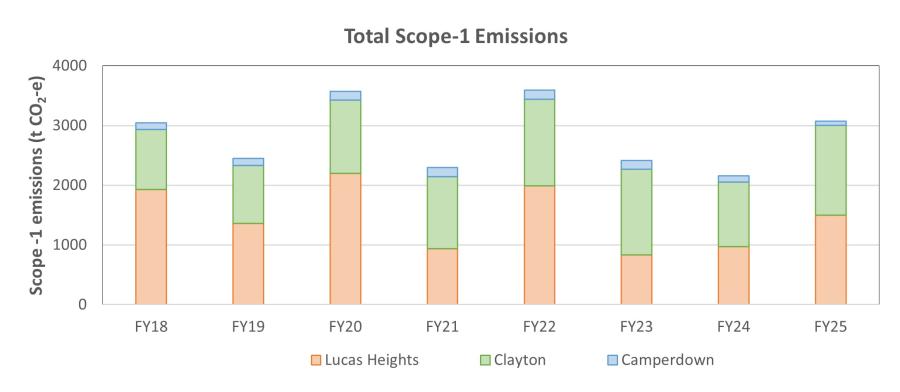
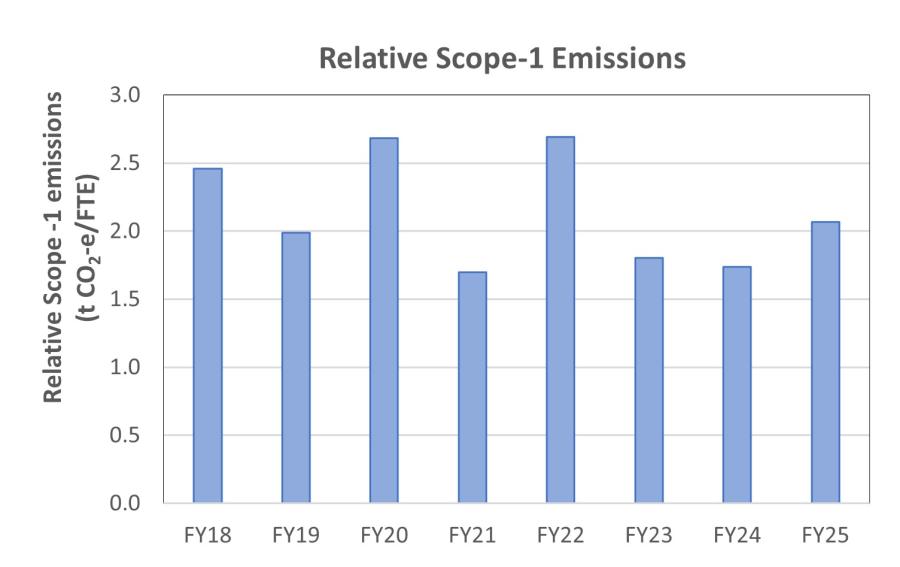
Scope-1 Emissions
Scope-1 emissions are direct emissions from the combustion of fuels and releases of fugitive gases.
Activities that contribute to ANSTO’s scope-1 emissions include: petrol, diesel and LPG consumption by fleet vehicles; natural gas consumption for heating purposes; diesel consumption by site stand-by diesel generators; combustion of acetylene and LPG; and, small fugitive emissions of refrigerant gases contained in heating, ventilation and air conditioning (HVAC) systems and sulphur hexafluoride (SF6) from the operation of linear particle accelerators.
There was a small increase in natural gas consumption at Clayton, which may be attributed to new beams lines being commissioned which has required more building space to be climate controlled.
There was an increase of SF6 emissions from the CAS facility in FY25, representing a ~0.5% loss from the inventory. The facility monitors SF6 emissions proactively using detectors and an inventory reconciliation system, noting that SF6 is highly inert and small leaks are difficult to identify. Where leaks are detected, maintenance on the affected parts are conducted urgently and incident investigations are conducted to determine if there are any systematic causes.
Emissions table (FY2024 vs FY2025)
| Emissions | Units | FY2024 | FY2025 | Change on previous year (%) |
|---|---|---|---|---|
| Scope-1 emissions (direct combustion/consumption of other energy sources other than electricity from the grid) | t CO2-e | 2,493 | 3,020 | 21.1 |
| t CO2-e /FTE | 1.74 | 2.07 | 19 | |
| Scope-2 emissions (electricity from grid) | t CO2-e | 46,438 | 44,621 | -3.9 |
| t CO2-e /FTE | 32.3 | 30.6 | -5.3 | |
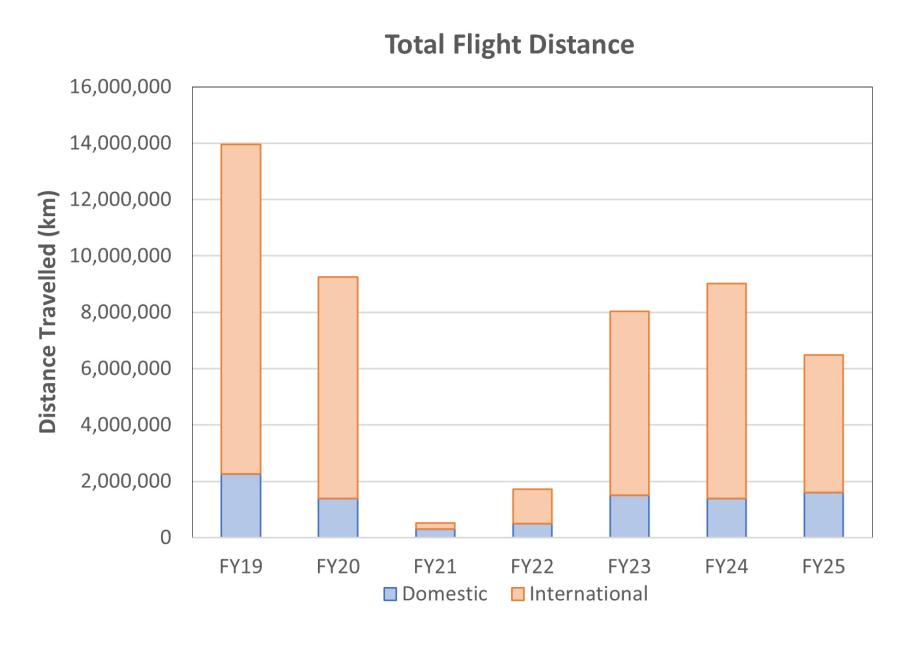
| Domestic air travel | km | 1,385,955 | 1,598,555 | 15 |
| km/FTE | 965 | 1,095 | 13 |
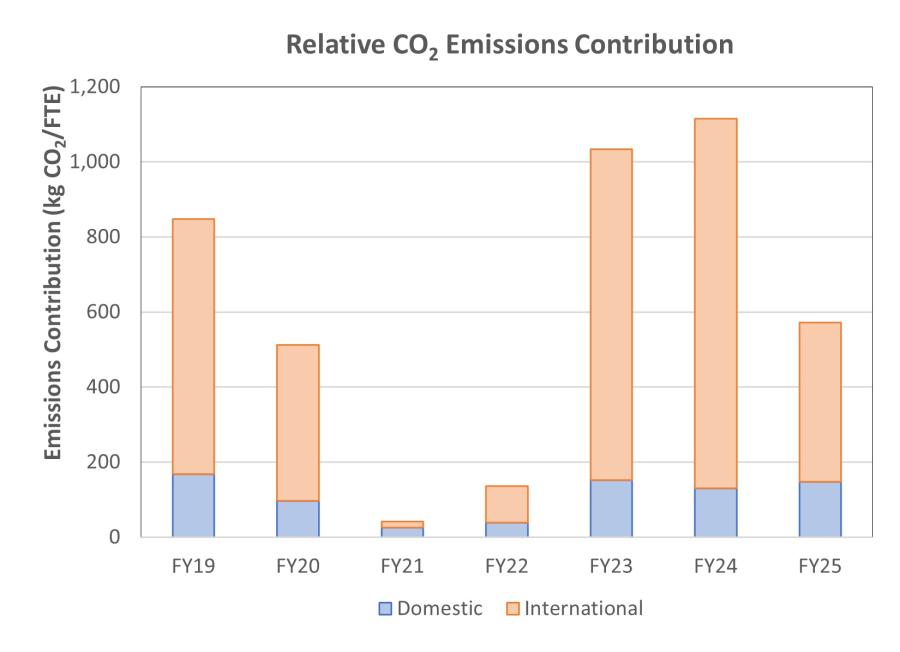
| t CO2-e | 187 | 215 | 15 |
| t CO2-e/FTE | 0.13 | 0.15 | 13 |
| International air travel | km | 7627659 | 4885385 | -36 |
| km/FTE | 5312 | 3347 | -37 |
| t CO2-e | 1413 | 620 | -56 |
| t CO2-e/FTE | 0.98 | 0.43 | -57 |
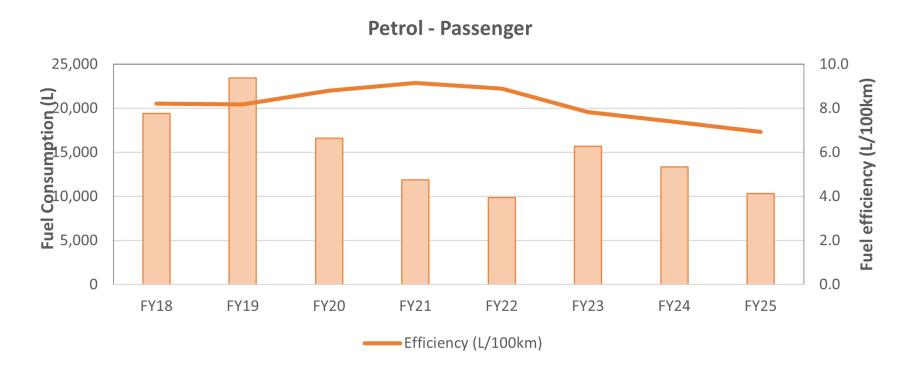
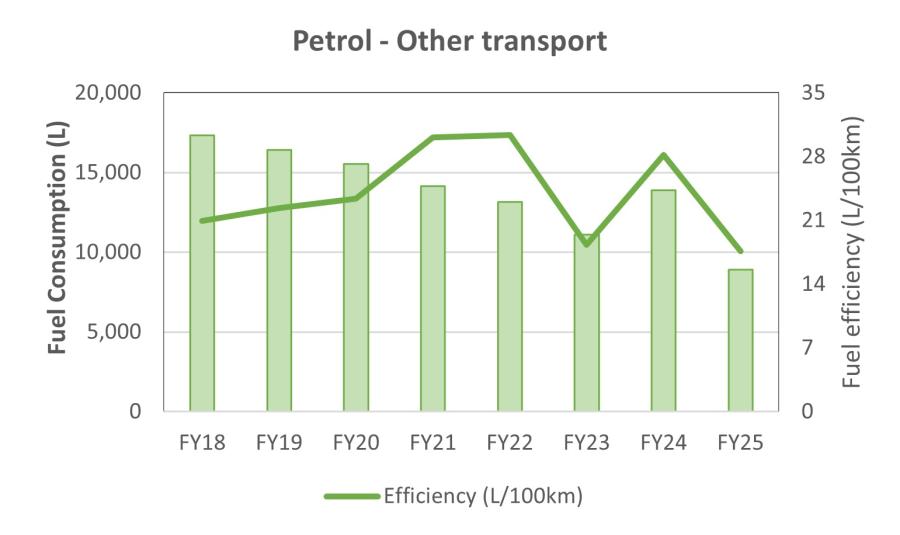
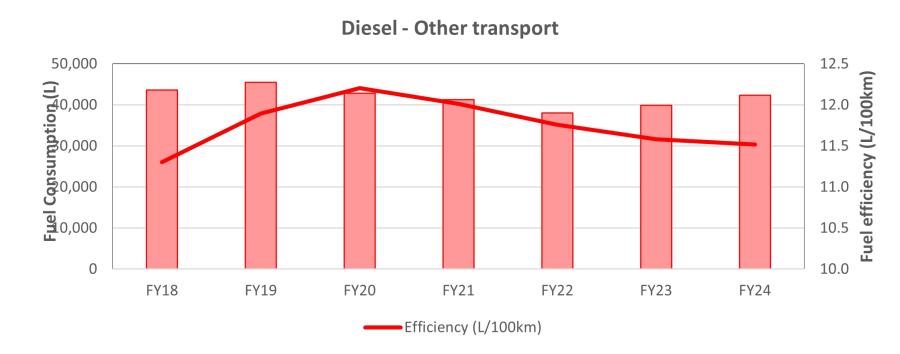
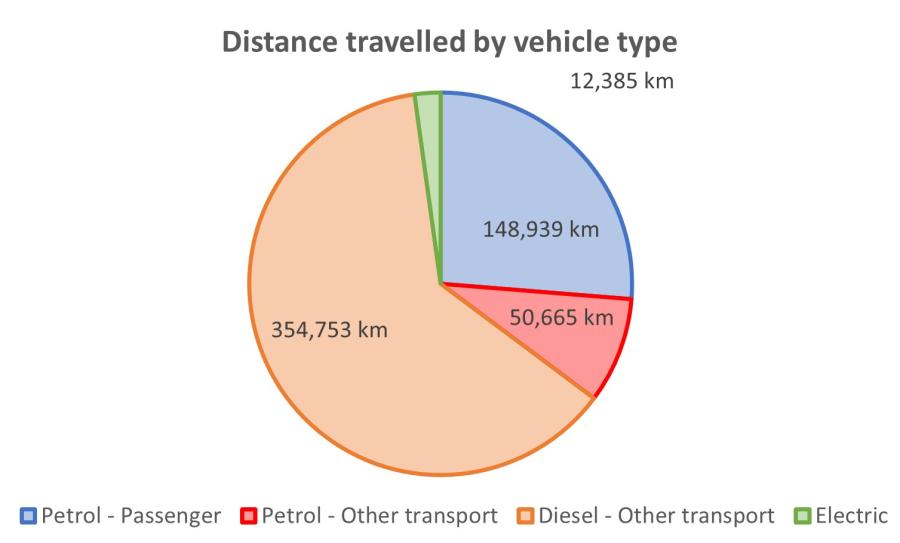
Fleet Vehicles
Overall, the fuel efficiency rate for both petrol and diesel fuelled vehicles has improved, indicating better utilisation of higher efficiency vehicles over less efficient vehicles.
ANSTO has introduced three zero emission (electric) vehicles and several hybrid-petrol vehicles within its passenger vehicle fleet. ANSTO is reviewing its fleet vehicle asset management plan to align with the Australian Government’s Fleet Selection Policy for low emission passenger vehicles and is planning to replace up to nine passenger vehicles in FY25 with low emissions options. There has been an increase in the distance travelled by full battery electric vehicles, now representing 2.2% of kilometres travelled, up from 1.4% in FY24.
Staff flights
ANSTO’s staff flight emissions profile has generally returned to similar pre-COVID activity levels, however international travel in FY25 has significantly decreased over the reporting period.
In FY24, ANSTO is required to report for the first time on business related car hire and accommodation activities through the APS Net Zero Reporting requirements. Whole-of-Australian-Government travel guidance is promoting staff to identify options to reduce travel-related emissions through avoidance, active choices and offsetting emissions. Car rental and accommodation service providers are being required to increase their emissions data reporting on rental and accommodation offerings. As these requirements materialise, staff will be better informed to make conscious decisions on the business-travel activities in the future.
Legend
| kWhw Kilowattt | hour per week |
|---|---|
| FTE | Full-time equivalent staff attendance |
| kW | kilowatt |
| GWh | Gigawatt hours |
| GJ | Gigajoules (1 billion joules) |
| km | kilometre |
| L | litre |
| CO2 | carbon dioxide |
| SF6 | sulphur hexafluoride |
| tCO2 | tonne carbon dioxide |
| t CO2-e | number of metric tons of CO2 emissions with the same global warming potential as one metric ton of another greenhouse gas, |